
How To Use Google
Analytics Properly [Stop Wasting Money]
You can’t improve your website if you don’t know exactly what needs improving. How people use and behave on your website is extremely valuable data and, when harnessed properly, can be used to make your website better, improve user experience and increase conversions.
That’s where Google Analytics comes in. Google Analytics is an online tool for capturing, measuring and analysing traffic to your website. But you need to know what you’re looking for and use this information properly.
In this article, we’ll teach you how to get the most out of your Google Analytics reports and make sure you’re spending your money wisely and maximising the value of your business website.
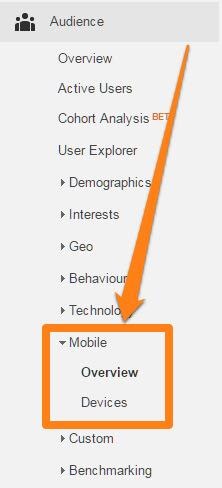 You can even find out which mobile devices/browsers your users are viewing your website on. This will tell you if your site is performing poorly on some devices. To access this information, go to Audience > Mobile > Overview > Devices.
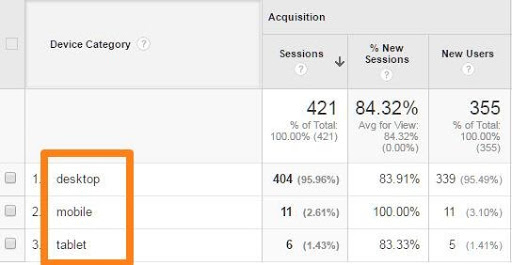 On the report metrics, check the bounce rate, time on site and page views. If one or more is not doing well, you may want to do some thorough browser testing on your website. Make sure to optimise your site for mobile so you don’t lose conversions coming from the 50th percentile of the traffic stats.
 Anything your users do on your website can be tracked and put into your goals. It can seem overwhelming to a beginner, but we recommend having these few set up as a starting point:
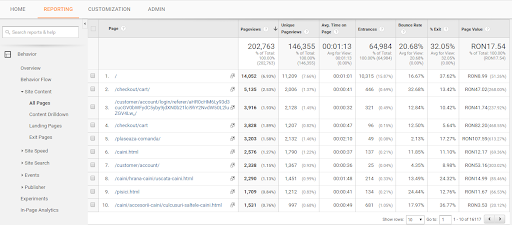
 Another powerful report is the Exit Rate Report. This is when a user visits multiple pages on your website and then leaves. The last page a site visitor viewed before leaving is called the exit page. The exit rate is important as it shows if a high number of people leaving your website are leaving from the same page(s). This tells you if a page needs optimising, for example for content, function or appearance. Understanding your audience and their behaviour can help you narrow down what it is about the exit pages that are driving visitors away.
To find the exit rate in your Google Analytics, go to Behavior > Site Content > All Pages.
Another powerful report is the Exit Rate Report. This is when a user visits multiple pages on your website and then leaves. The last page a site visitor viewed before leaving is called the exit page. The exit rate is important as it shows if a high number of people leaving your website are leaving from the same page(s). This tells you if a page needs optimising, for example for content, function or appearance. Understanding your audience and their behaviour can help you narrow down what it is about the exit pages that are driving visitors away.
To find the exit rate in your Google Analytics, go to Behavior > Site Content > All Pages.
1. Know How Your Website is Doing on Mobile
People today are using mobiles far more than their desktop PC [Source here]. If you want your website to be successful in generating conversions, you’ll need to pay attention to how it looks and functions across different platforms and ensure high-quality web design across devices of all shapes and sizes. The mobile performance report on Google Analytics will tell you how your website is performing on users’ mobiles. It shows how well your site is optimised for mobile and where you need to make improvements.
You can even find out which mobile devices/browsers your users are viewing your website on. This will tell you if your site is performing poorly on some devices. To access this information, go to Audience > Mobile > Overview > Devices.
On the report metrics, check the bounce rate, time on site and page views. If one or more is not doing well, you may want to do some thorough browser testing on your website. Make sure to optimise your site for mobile so you don’t lose conversions coming from the 50th percentile of the traffic stats.
2. Know Your Advertising Performance
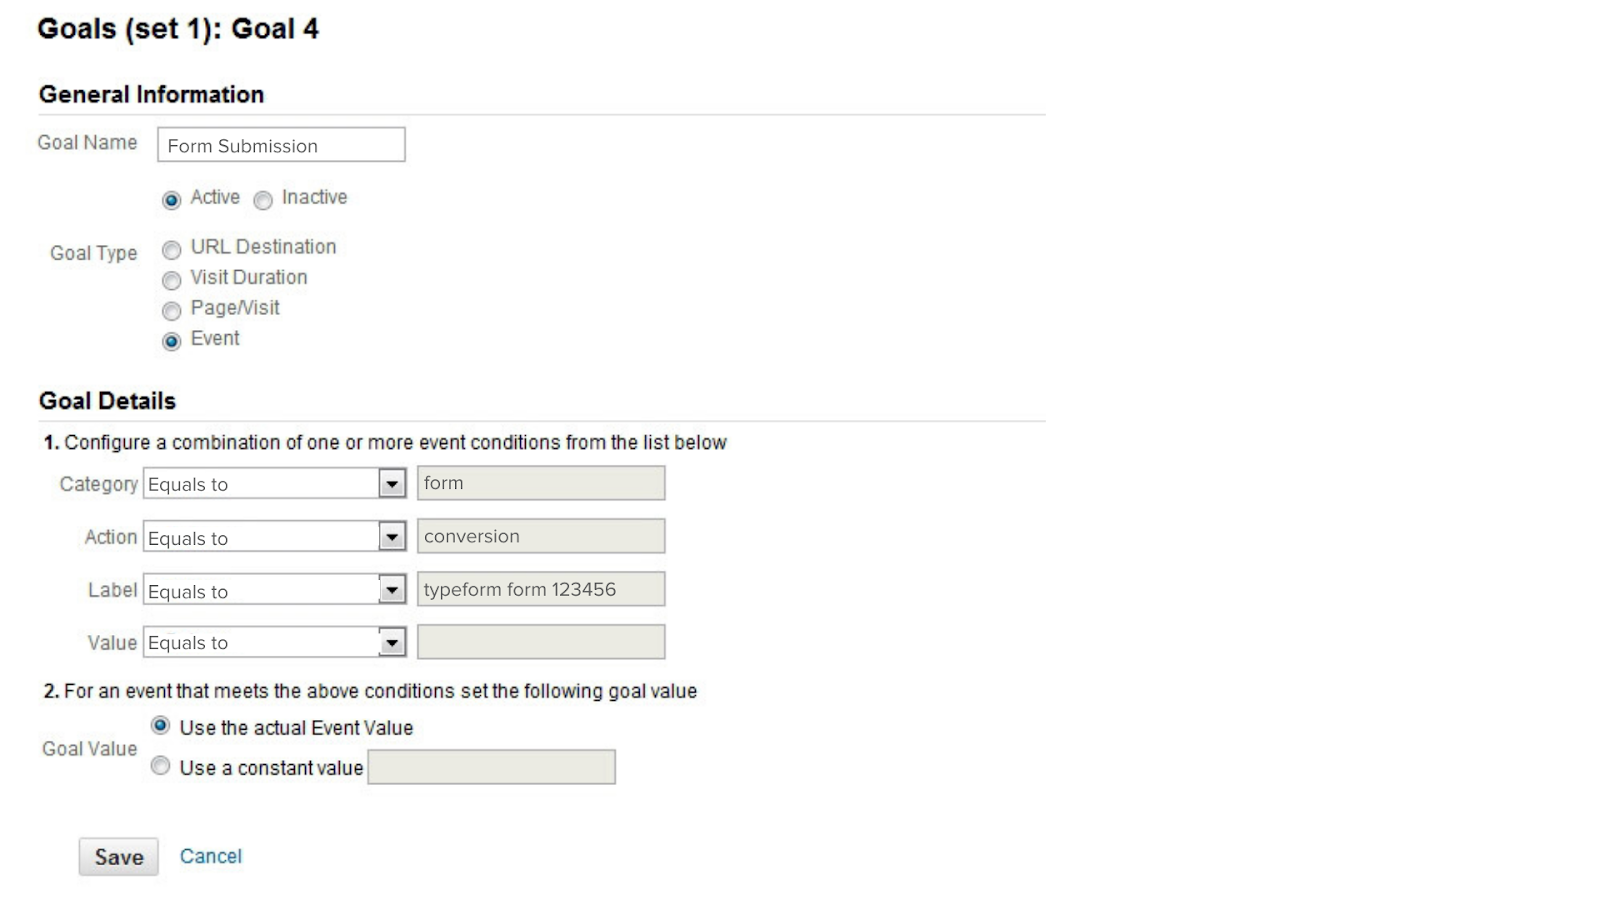
You’ve probably got newsletters, lead pages and/or paid ads running for your website. The most important information you can get from these marketing efforts is whether or not they’re actually bringing in conversions. Finding this out is easy – you can tell Google Analytics what’s important for your business and it’ll keep track of that information for you. You can even specify the type of goal – micro (like newsletter subscriptions) or macro (like sales or leads). To set up your goals, go to Admin > Goals > + New Goal > Enter a description and the details of your goal. For example, if you want to keep track of the lead form submissions on your website. Add a new goal, name it Form Submission and choose the Goal type.
Anything your users do on your website can be tracked and put into your goals. It can seem overwhelming to a beginner, but we recommend having these few set up as a starting point:
- Conversions
- Events
- Custom reports
- Segments
- Dashboard
3. Know Which Content of Your Website is Getting the Most Traffic
The next thing you need to know is: what content are visitors to your website spending the most time on? Maybe it’s your blogs, product page or gallery. This is crucial information to have in order to know if your website appearance, content and functionality is working. The Content Efficiency Report in Google Analytics tells you what’s attracting the most interest on your website. This report combines metrics such as page title, unique visitors, bounce rate and more. This powerful tool shows what content drives the highest business traffic which, in turns, tells you where to direct your improvements.3. Know How Users are Interacting with Your Website
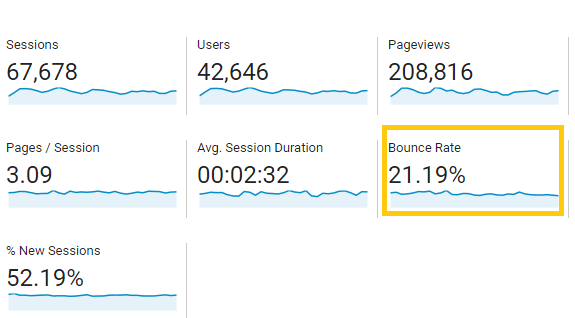
Are your website visitors leaving your website without browsing from the landing page? Do they view multiple pages in quick succession before leaving? How people behave on your website is important information when looking to improve user experience, drive conversions and, ultimately, increase business profits. There are two reports available on Google Analytics that will help you narrow down what needs improving on your website – the Bounce Rate Report and Exit Rate Report. A bounce occurs when a visitor goes into your site then leaves from the landing page without going to another page. Bounces happen when a visitor closes the browser window, types another URL in the address bar, or when the back button is clicked. Hence, the term ‘bounce’ because it seems like a ball bouncing from your page. The more bounces there are the higher the bounce rate. A high bounce rate may not mean your site isn’t adding value to the user. You may have a high bounce rate because the information your visitor is looking for is available straight away and they need not trawl through your website to find it. However, best practice would suggest a high bounce rate is not a good thing and to look further into reasons why it might be happening. To check your average bounce rate go to Audience > Overview Report. There you’ll find a box with information about your Average Bounce Rate.
Another powerful report is the Exit Rate Report. This is when a user visits multiple pages on your website and then leaves. The last page a site visitor viewed before leaving is called the exit page. The exit rate is important as it shows if a high number of people leaving your website are leaving from the same page(s). This tells you if a page needs optimising, for example for content, function or appearance. Understanding your audience and their behaviour can help you narrow down what it is about the exit pages that are driving visitors away.
To find the exit rate in your Google Analytics, go to Behavior > Site Content > All Pages.