
Dimensions and Metrics in Google Analytics Defined [+Bonus Info for eCommerce Retailers]
The building blocks of any Google Analytics report are dimensions and metrics. These are your variables. You can create numerous combinations of these variables, although not all combinations will work.
Before creating your report, you need to know what results you’re after – that’ll help you pick which dimensions and metrics you should ask for in your report.
This article outlines how to put together a report in Google Analytics, what dimensions and metrics are and how to use them. Plus, there’s some bonus information for eCommerce retailers so make sure you read to the end!
How do I create a report in Google Analytics?
Before we get into the nitty gritty of what variables you want to include in your report, you’ll need to know how to create a report in Google Analytics.
Once you’ve signed in, go to your main Analytics dashboard for the website you’re tracking. Open Reports. Click Customization > Custom Reports > +New Custom Report.
Here, you can start building your report with your desired dimensions and metrics.
What are dimensions in Google Analytics?
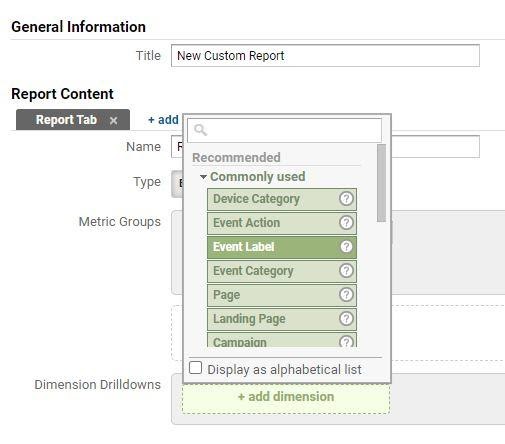
Dimensions are the elements of your data. In the image below you can see the various dimension options you can choose when creating your custom report. For example, the country in which visitors to your website are located in a dimension variable, as is the device type on which they’ve viewed your website.
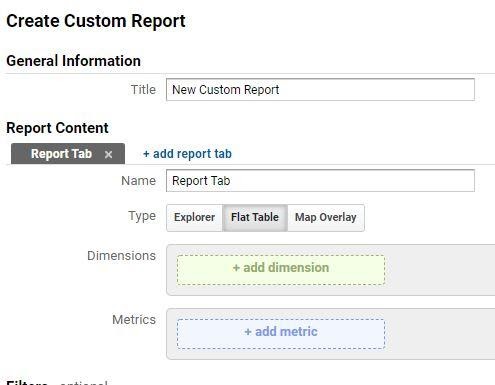
By default, Google Analytics chooses Explorer as the report type. This offers you only two dimensions to compare – a main and a sub. To compare multiple dimensions, change the report type to Flat Table (as in the image below). You will then be able to compare up to five dimensions.
What are metrics in Google Analytics?
Metrics are the numbers used to measure one of the characteristics of your chosen dimensions. So, if you wanted to see the number of sessions (group of actions on your page within a given time frame/campaign) and average duration of a session you would select Session and Pages/Session respectively.
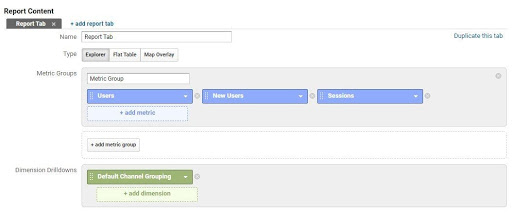
In the image below, you can see an example of a report being created with both dimensions and metrics. This search would be particularly useful if you want to know which of your marketing channels are working.
What important dimensions and metrics should eCommerce retailers watch out for?
Dimensions
- Checkout Options: The payment type and delivery options chosen by customers completing a transaction on your website. Knowing how your customers are choosing to shop helps you optimise these options for the future.
Metrics
- Revenue: The total revenue on your website. This is invaluable information to be able to compare over a chosen time period or campaign to see if your marketing initiatives are working.
- ROAS (Return on Ad Spend): The average revenue earned for each dollar spent on Google AdWords. Tracking this helps you recognise positive or negative trends and correct them before its too late.
- Average Order Value: The average spend (i.e. revenue) per transaction on your website. This helps you determine the behaviour of your customers. It can help boost sales if you recommend items in a similar price or type range.
- Page Value: A value assigned for a page of your website a user visited before completing a conversion or eCommerce transaction. If a page you’ve created to assist conversions has a low page value, that tells you that something is going wrong on that page.
- Abandoned Funnels: The percentage of website visitors actively working towards a conversion but who left the funnel without completing a conversion. This metric tells you if your funnel needs redesigning.
Conclusion
Google Analytics offers a great deal of functionality for its users. The hardest part isn’t using the tool so much as knowing which options to choose. You can’t always compare certain variables with each other, so discovering which combinations work together may take time. We hope this article has given you some idea of which searches to perform to help you learn more about whether or not your marketing efforts are getting the results you want.
If you have any questions about this article, please don’t hesitate to contact us.