
Beginners’ Guide to Google Analytics
Does your business have an e-commerce website? Do you have a blog? Whatever your website’s purpose is, you need a tool that can measure your website traffic and can gather crucial information about your website visitors. This is where Google Analytics can help.
Google Analytics gives you an idea as to who your website visitors are, where they’re coming from, which pages they’re visiting, how long they’re staying on your site and why and when they’re leaving your site.
As a beginner, you need to know this information to make sure that you’re not wasting a lot of money and effort on targeting the wrong type of audience.
In this guide, we’ll go into detail about Google Analytics – reasons to use it, understanding its metrics, how to install it and how to use it for business.
Reasons to Use Google Analytics in your Business
Completely Free of Charge
Google Analytics is a free powerful tool for tracking patterns on your website. It also integrates with other Google products, such as Google AdSense and Google AdWords. You can also get paid versions of Google Analytics: Google Analytics 360 and Google Analytics for Mobile Apps.
Better Marketing Insights
Google Analytics reports can offer insights into how to improve or redirect your marketing efforts. Knowing how much traffic is being driven to your website by each of your marketing channels, where your visitors live or which sites most of your visitors are coming from can determine the channels you need to invest more in and which to dismiss.
Better SEO
You can boost your revenue from SEO when you have more information about your site visitors and your target audience. Google Analytics reports determine how much traffic your site is getting, which landing pages get the most traffic, what search queries visitors conduct to find your site and more. With this information, you can plan your SEO strategy better and boost your revenue from SEO.
Improve Site Performance
Google Analytics reports give you an idea of which pages on your website get the most traffic, where visitors leave your site and how quickly your pages load. Using this information, you can improve your site performance. For example, let’s say that your Resources page gets the most traffic. This is a cue for you to produce more articles and to increase promotion of that page to boost traffic even further.
Understanding your Google Analytics Metrics
Here we’ve put together a list of the Google Analytics metrics we think are most important to have in your Beginner’s Google Analytics toolkit.
1. Users – The number of unique visitors to your website. As long as someone uses the same device/browser, even if they visit your website 50 times they’d still only be counted as one user.
2. Returning Users – Visitors who are accessing your website for the second (or more) time/s using the same device/browser as for their first visit.
3. New Users – Visitors accessing your website for the first time or who are using a different device/browser from the first time they visited your site. This term also applies to visitors who cleared their browser cookies and then returned to your site.
4. Sessions – The total number of visits to your site, both new and repeat visits. If someone visits your website 50 seperate times using the same device/browser, this is counted only as one user but as 50 sessions.
5. Average Session Duration – How long, on average, visitors are staying on your site. Average Session Duration is the total duration of all sessions (in seconds) divided by the total number of sessions.
6. Percentage of New Sessions – The total percentage of first-time sessions on your website in a given period. A first-time session is a visit to your website by someone new (or a previous visitor but one who is using a different device/browser from the first time they visited your site or one who has cleared cookies on a browser previously used to access your site).
7. Sessions by Channel – The number of sessions attributed to each channel e.g. organic, paid, direct, social and email.
8. Bounce Rate – Visitors who leave after viewing a single page at your website (hence, the term ‘bounce’). Bounce rate is the number of single-page sessions divided by the total number of sessions.
9. Pageviews per Session – The number of page views divided by the total number of sessions. More pages per session means that visitors are spending more time exploring your website.
10. Pageviews – Any time a page on your website was loaded, reloaded or returned to. This metric doesn’t tell the number of times a page was viewed per session, but can be very useful when used in combination with other Google Analytics metrics.
11. Goal Completions – The number of times a specific goal has been completed by your website visitors. Goals are different for every business. As such, you need to define each particular goal (e.g. signups, checkouts, visits to a particular URL) in order for this to be added to your Google Analytics metrics.
How to Install Google Analytics
The ease of setup is another reason to like Google Analytics. If you happen to have a main Google account that you use for other Google services like Gmail, Google Drive, Google Calendar, or Google+, then you should use that when setting up your Google Analytics account. Otherwise, you should sign up for a new user account.
Here’s an important tip: If you’re hiring someone to work on your Google Analytics account for you, make sure they use your Google Account to do so. You don’t want them to take your Google Analytics data with them. It’s better that you create the Google Analytics account and invite them to collaborate.
Now, let’s get started. To install Google Analytics, do the following:
- Go to https://marketingplatform.google.com/about/analytics/ and click the Sign in to Analytics button.
- Click the Start measuring button.
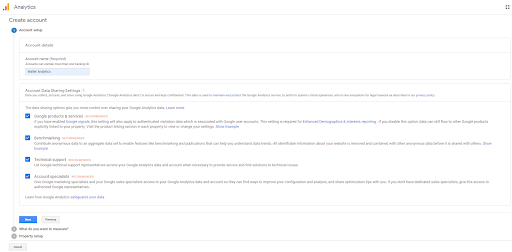
- Fill in the boxes asking for info on your Account Name and how you’d like to configure your data sharing settings.
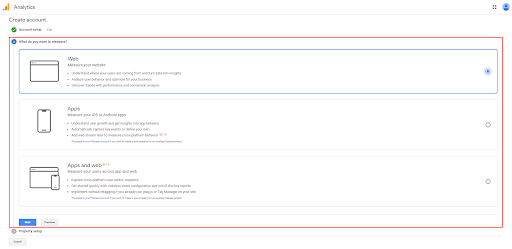
4. Choose what you want to measure.
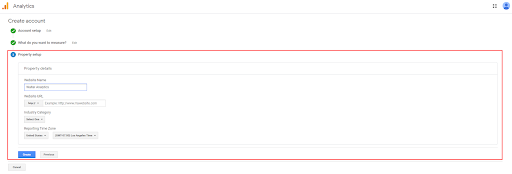
5. Fill in the boxes asking for information about your website.
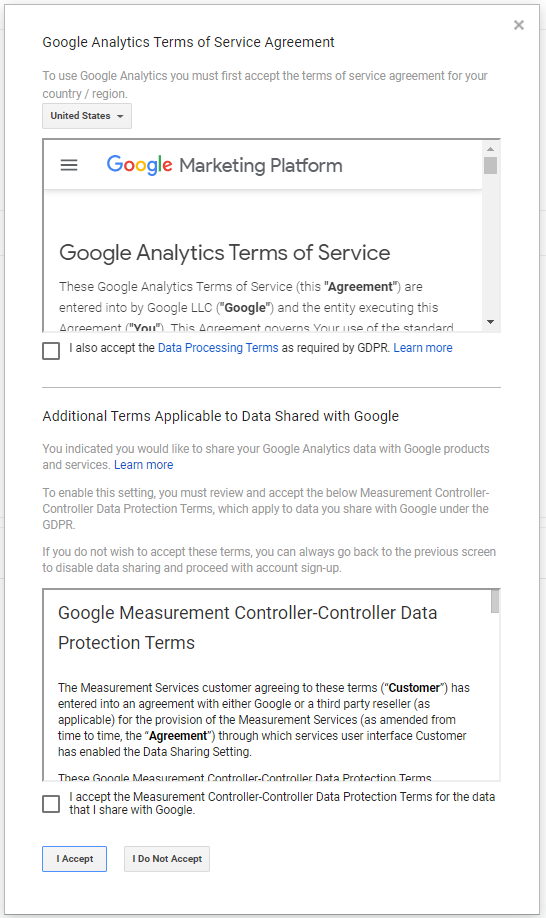
6. Read and accept the Google Analytics Terms of Service Agreement.
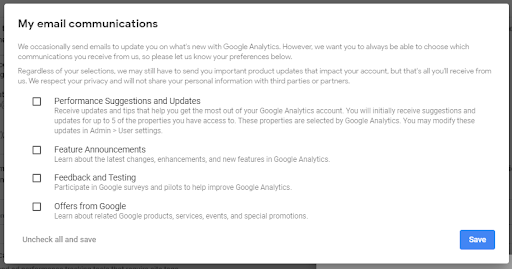
7. Choose which email communications you want to receive.
8. Once you are finished with setting up your account and property, it’s now time to get your tracking code.
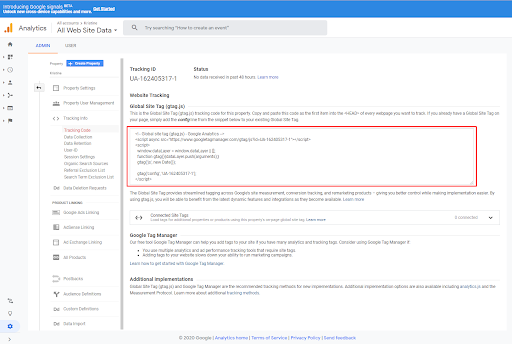
This must be installed on every page on your website that you want to track by Google Analytics. The code installation depends on what type of website you have and what Content Management System (CMS) you’re using.
- Installing to a WordPress website:
You can install a plugin for WordPress such as MonsterInsights and Yoast to help you easily install your tracking code to any page of your website.
2. Installing to an HTML website:
You can add your tracking code to the source code of all your webpages. You may use an online HTML editor or in Notepad for Windows or TextEdit for Mac. You can install your tracking code by adding it before the </head> tag on every page you want to track. Then upload the file to your web host using an FTP program (such as SmartFTP).
3. Installing to an e-commerce site:
In an e-commerce store, you need to go to your Online Store settings and paste in your tracking code where specified.
4. Install using Google Tag Manager:
You can install using Google Tag Manager if you have an existing Tag Manager container installed on your website.
9. Start to learn about your audience. This may take up to 24 hours to be up and running. But remember, patience is a virtue!
How to Use Google Analytics for Business
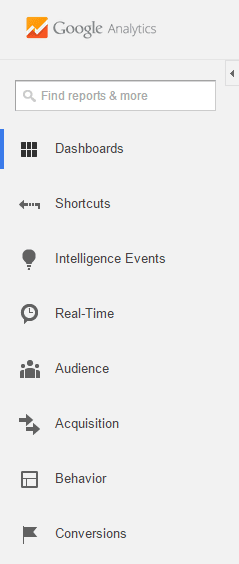
As soon as your Google Analytics account is all set up and running, you’ll start receiving various reports. For a complete beginner the generated reports and graphs can be confusing and overwhelming. But, we’re here to help. We’ll walk you through each of the four main tabs of your Google Analytics account: Home, Reporting, Customization and Admin tabs.
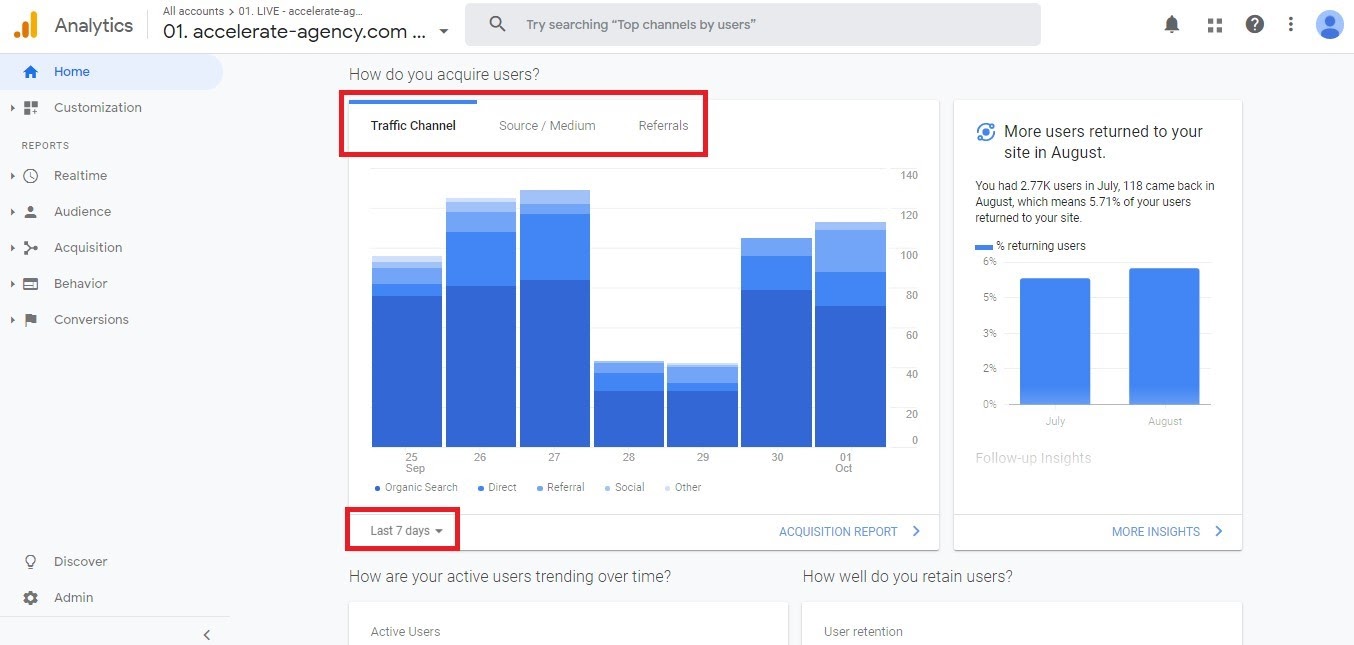
- Home Tab
The Home tab gives you an overview of your entire account with sessions, average session duration, bounce rate and goal conversion rate. If you have more than one website, you can view each of them from one account.
2. Reporting Tab
The Reporting tab displays different dashboards that can give you an insight into how your website is performing so that you know which areas to improve. Next, we’ll briefly cover some of the subtabs within the Reporting Tab.
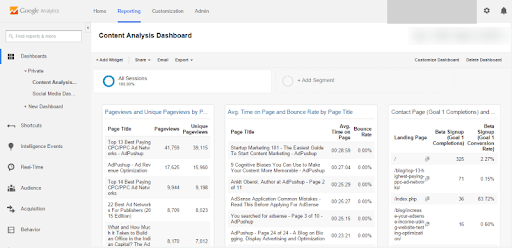
- Reporting Tab> Dashboards Subtab
Your dashboard is easily customisable with all the important widgets you’d like to add. You can keep track of what you feel is important for you, as the success of your social media campaigns, your content performance and much more.
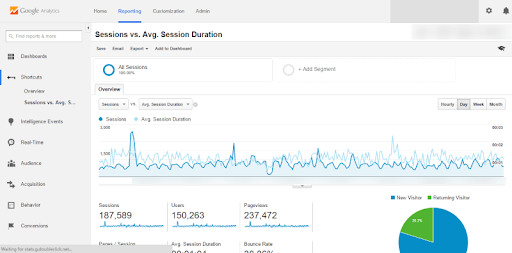
- Reporting Tab> Shortcuts Subtab
Gives quick access to the reports that you need regularly. Just adjust the date range you need every time you access a report.
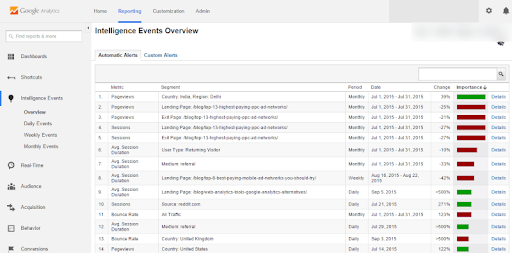
- Reporting Tab> Intelligence Events Subtab
Shows you an overview of any statistically significant variations in your website traffic and behaviour. When clicked, you will be given two tabs: Automatic Alerts and Custom Alerts.
On the Automatic Alerts tab, you’ll see the changes in your website traffic statistics. On the Custom Alerts tab, you’ll receive alerts when your web traffic reaches a goal that you’ve previously specified. Apart from the Intelligence Events Overview, you can take a look at your daily, weekly and monthly events.
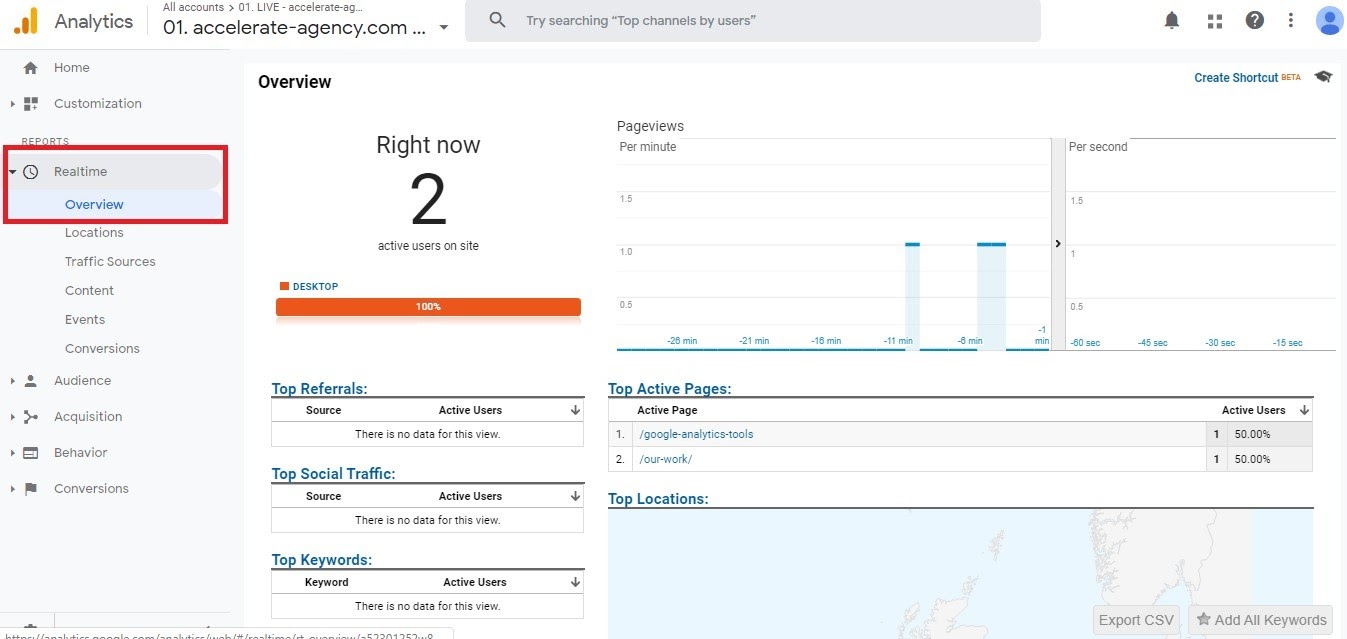
- Reporting Tab> Real-Time Reports Subtab
Gives real-time reports on the exact number of visitors currently on your website, the number of your website pages being viewed per minute and per second, the top keywords your active visitors are using and a list of your top active pages, together with the number of active visitors on each of those pages. You can also check other tabs reflected in real-time such as location, traffic sources, events and conversions and content.
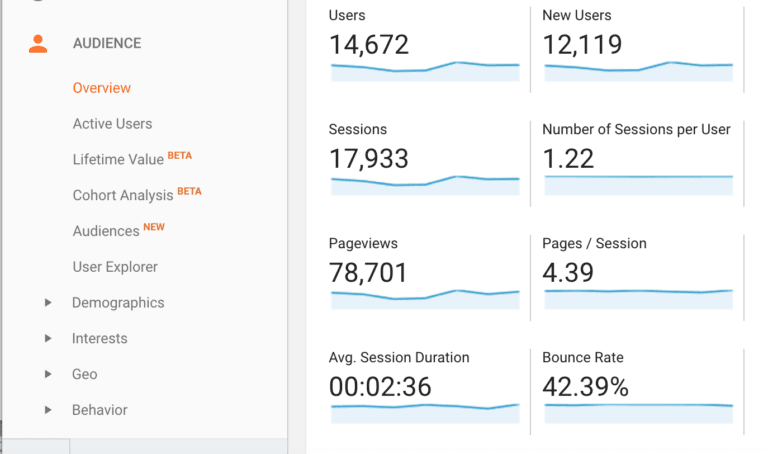
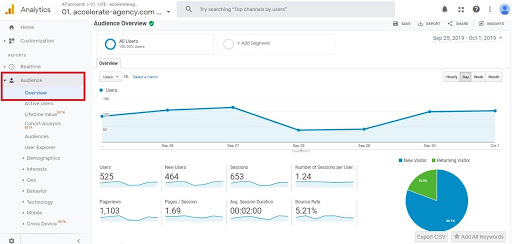
- Reporting Tab> Audience Reports Subtab
Gives information on your website visitors, including how many sessions there are in a given period of time (hourly, daily, weekly and monthly). You can also find out the:
- number of users
- number of pageviews
- number of pages per session
- average session duration
- bounce rate
- percentage of new sessions
- ratio of new visitors to returning visitors (in pie chart form)
- location of website visitors (country, city)
- language website visitors are using
- browsers website visitors are using
- service providers and operating systems website visitors are using
Apart from the Overview tab in Audience reports, you will find Demographics, Interests, Geo, Behavior, Technology, Mobile, Custom, Benchmarking and Users Flow tabs.
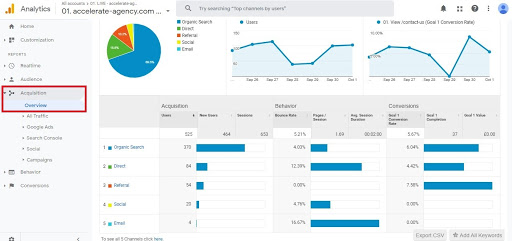
- Reporting Tab> Acquisition Reports Subtab
How visitors came to your website. This subtab provides you with an overview of your direct, organic, referral, social and email traffic. Here, you can also see how your Pay Per Click (PPC) campaigns are performing. All you have to do is link your Google Ads account to your Google Analytics account. You can also find out the keywords visitors to your website used to find you by clicking on the Search Engine Optimization tab (first, ensure you have linked your Google Search Console account to your Google Analytics account).
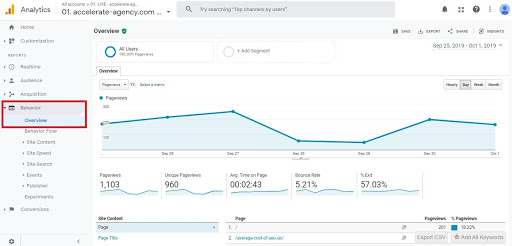
- Reporting Tab> Behavior Reports Subtab
How your visitors interact with your website. This is useful as it helps you know if your content is performing. The Behavior Reports subtab has the following options:
- Behavior Flow – gives you an idea of what pages your visitors are viewing, from the landing page through to the exit page.
- Experiments – allows you to do A/B testing to see which landing pages perform the best.
- In-Page Analytics – allows you to view your web pages together with your Google Analytics data.
In addition to these options, there are additional reports such as Site Content, Site Speed, Site Search, Events and Publisher reports.
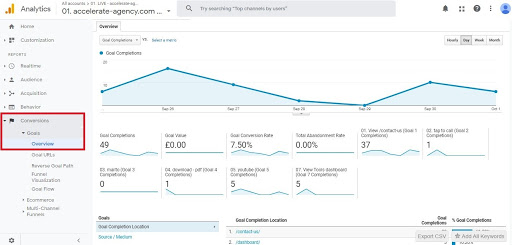
- Reporting Tab> Conversion Reports Subtab
The actions your visitors have taken before they actually converted. There are four different reports under these: Goals, Ecommerce, Multi-Channel Funnels and Attribution. The Goals reports allow you to create and track your predefined goals that lead to conversions. The Ecommerce reports will give you an idea of your customer’s activity within your ecommerce store (if you have one). The Multi-Channel Funnel reports show how different marketing channels perform in terms of leading to conversions. Lastly, the Attribution reports tell you the different advertising channels that led your visitors to a conversion.
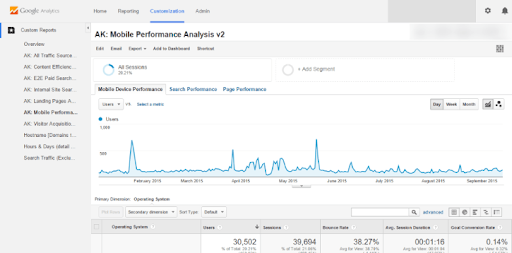
3. Customisation Tab
Lets you create and track custom reports according to your needs. There is no limit to the number of reports you can create – you can create as many as you need.
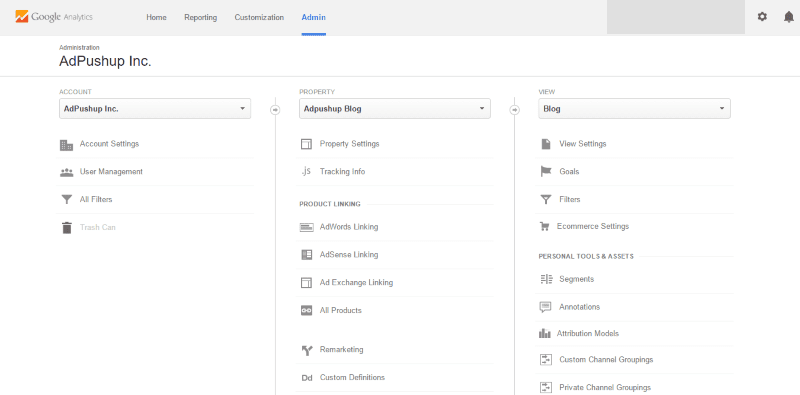
4. Admin Tab
Manage your account and switch from one account to another (if you have multiple accounts). Here, you can also link your other Google services like Google Ads and Google AdSense.
Conclusion
Google Analytics is a powerful tool for measuring your website traffic and performance. Given the right information with the right knowledge and focus, you can achieve positive results quickly!
Understand the growth opportunities on your website.
Turn your data into dollars.
We are experts in Google Analytics, Google Tag Manager and Google Data Studio. If you’re not collecting the right website and marketing data, then you’re missing out on the opportunity to make better business decisions! We offer comprehensive website analytics audits, tagging audits and implementation, and we can set up dashboards to help your team get relevant data from a range of reporting systems automatically.. We can also set up powerful automation to save your team dozens of hours per week, and let your marketing systems work together more effectively.
Most websites have tracking issues, either tracking the wrong metrics, or not tracking consistently. If you’re relying on your website analytics to track your conversions from your digital marketing, then you are most likely leaking money. Our comprehensive website analytics audit will help you identify issues so they stop costing your business a substantial amount of money every day.